Limited Time 30% Discount Offer Use Code - off30
Actualkey Prepration Latest 1Z0-1111-25 : Oracle Cloud Infrastructure 2025 Observability Professional Exam Questions and Answers PDF's, Verified Answers via Experts - Pass Your Exam For Sure and instant Downloads - "Money Back Guarantee".
| Vendor | Oracle |
| Certification | Oracle Cloud Solutions |
| Exam Code | 1Z0-1111-25 |
| Title | Oracle Cloud Infrastructure 2025 Observability Professional Exam |
| No Of Questions | 61 |
| Last Updated | March 25,2025 |
| Product Type | Q & A with Explanation |
| Bundel Pack Included | PDF + Offline / Andriod Testing Engine and Simulator |
Format: Multiple Choice
Duration: 90 minutes
Exam Price: $25
Number of Questions: 50
Passing Score: 68%
Validation: This Exam has been validated against Oracle Cloud Infrastructure 2025
Policy: Cloud Recertification
Earn associated certifications
Passing this exam is required to earn these certifications. Select each certification title below to view full requirements.
Oracle Cloud Infrastructure 2025 Certified Observability Professional
Prepare to pass exam: 1Z0-1111-25
The Oracle Cloud Infrastructure 2025 Observability Professional Certification is designed for Site Reliability Engineers, Cloud Operations, Application Developers, Cloud Administrators, and roles involved in monitoring and troubleshooting OCI environments. The target candidate should be familiar with core OCI services such as Compute, Storage and Networking. The exam validates the following topics:
• Distinguish the purpose of OCI Observability and Management platform
• Demonstrate OCI Monitoring service with metrics and alarms
• Illustrate how to respond to cloud resource changes in real-time using OCI Events
• Describe centralized management of log data with OCI Logging
• Create visualizations and identify log data patterns with OCI Logging Analytics
• Explore methods to monitor applications with deep visibility using OCI Application Performance Monitoring
• Explain monitoring of distributed components in an application stack with OCI Stack Monitoring
Take recommended training
Complete one of the courses below to prepare for your exam (optional):
Become an OCI Observability Professional (2025)
Additional Preparation and Information
A combination of Oracle training and hands-on experience (attained via labs and/or field experience), in the learning subscription, provides the best preparation for passing the exam.
Review exam topics
The following table lists the exam objectives and their weightings.
Objectives % of Exam
Define the pillars of Observability 7%
Monitor cloud environments with metrics and alarms 18%
Respond to cloud resource changes in real-time 10%
Centrally manage and visualize log data 16%
Identify log data patterns and create visualizations for advanced analytics 22%
Monitor applications with deep visibility into end-user experience 20%
Monitor distributed components of an application stack 7%
Define the pillars of Observability
Summarize on OCI Observability and Management Services
Monitor cloud environments with metrics and alarms
Explain the key concepts of Monitoring Service
Discuss on enabling Metrics for monitoring OCI resources
Configure Alarm Definitions using best practices
Respond to cloud resource changes in real-time
Analyze the key concepts of Events Service
Determine Event Structure, Event Types and Rules
Respond to Events and integration with OCI services
Centrally manage and visualize log data
Distinguish log categories and enabling log collection from sources
Explore managing and searching logs from entire log estate
Create Connectors for Log Transitions
Identify log data patterns and create visualizations for advanced analytics
Distinguish the key concepts of Logging Analytics
Explore log ingestion methods for Logging Analytics
Analyze on search, filter and visualize logs
Present advanced analytics and features for troubleshooting
Monitor applications with deep visibility into end-user experience
Explore the key concepts of Application Performance Monitoring (APM)
Instrument applications for data collection
Examine visualizing and analyzing performance data
Monitor distributed components of an application stack
Identify the key concepts of Stack Monitoring
Analyze on discovering resources and monitoring with metrics
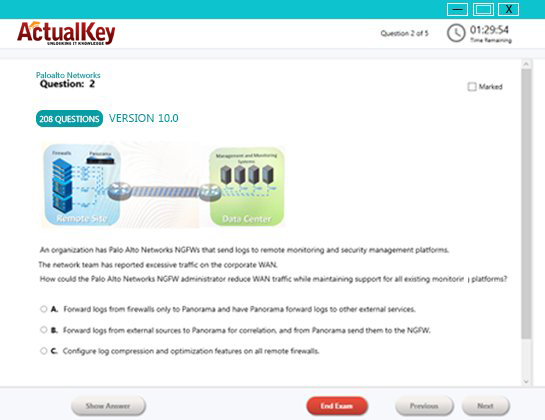
Sample Question and Answers
QUESTION 1
You are working on a project to automate the deployment of Oracle Cloud Infrastructure (OCI)
compute instances that are pre-configured with web services. As part of the deployment workflow,
you also need to create a corresponding OCI object storage bucket bearing the same name as that of
the compute instance. Which of these two options can help you achieve this requirement? (Choose two.)
A. Cloud Agent Plugin for the compute instance
B. Service Connector Hub
C. Oracle Functions
D. OCI CLI command, oci os bucket create auto
E. Events Service
Answer: B, C
Explanation:
To automate the creation of an OCI Object Storage bucket with the same name as a compute
instance during deployment, you need a mechanism to detect the instance creation event and trigger
an action to create the bucket. Two OCI services that can achieve this are Service Connector Hub and
Oracle Functions, used in conjunction with the Events Service.
Service Connector Hub (B): This service acts as a cloud message bus that facilitates data movement
between OCI services. You can configure a service connector with the Events Service as the source
(to detect compute instance creation events, e.g., com.oraclecloud.computeapi.launchinstance.end)
and Oracle Functions as the target. The service connector filters and routes the event to trigger a function.
Oracle Functions (C): This is a serverless platform that allows you to write and execute code in
response to events. You can create a function that retrieves the compute instance name from the
event payload and uses the OCI SDK or API to create an Object Storage bucket with the same name.
Why not A, D, or E alone?
Cloud Agent Plugin (A): This is used for monitoring and managing compute instances but does not
directly support bucket creation automation.
OCI CLI command (D): The command oci os bucket create auto is not a valid OCI CLI command (oci os
bucket create is valid but requires manual invocation or scripting, not event-driven automation).
Events Service (E): While critical for detecting instance creation, it alone cannot execute the logic to
create a bucket”it needs a target like Functions or Notifications.
This solution leverages the event-driven architecture of OCI, combining Events Service (implicitly
used with Service Connector Hub) and Oracle Functions for execution.
Reference: OCI Events Service, Service Connector Hub, Oracle Functions
QUESTION 2
What happens in Stack Monitoring after Management Agents are set up and resources are discovered?
A. Metric data is immediately collected
B. Alarm rules will trigger when resources are down or performance thresholds are crossed
C. Management Agents discover resources that are running locally on the instance
D. OCI Notifications send email notifications
Answer: A
Explanation:
In OCI Stack Monitoring, once Management Agents are deployed and resources (e.g., databases,
applications) are discovered, the immediate next step is the collection of metric data.
Metric data is immediately collected (A): Management Agents are lightweight processes that
continuously collect performance and health metrics from discovered resources (e.g., CPU usage,
memory utilization) and send them to OCI services like Monitoring or Stack Monitoring. This data
becomes available for visualization and analysis right after discovery.
Why not B, C, or D?
Alarm rules (B): Alarms are configured separately in the OCI Monitoring service and only trigger after
metric data is collected and thresholds are breached”not an immediate post-discovery action.
Resource discovery (C): Discovery happens before this stage, as the question assumes resources are
already discovered. Agents dont rediscover resources post-setup.
Notifications (D): Notifications require separate configuration (e.g., via the Notifications service) and
are not an automatic outcome of agent setup and discovery.
This aligns with Stack Monitorings purpose of providing real-time visibility into resource performance.
Reference: Stack Monitoring Overview, Management Agent
QUESTION 3
What are the two items required to create a rule for the Oracle Cloud Infrastructure (OCI) Events Service? (Choose two.)
A. Management Agent Cloud Service
B. Actions
C. Rule Conditions
D. Install Key
E. Service Connector
Answer: B, C
Explanation:
To create a rule in the OCI Events Service, you need to define what triggers the rule and what
happens when its triggered. The two required components are:
Actions (B): These specify the tasks to perform when an event matches the rule (e.g., invoking a
function, sending a notification, or streaming to a service). Without an action, the rule has no effect.
Rule Conditions (C): These define the criteria for matching events (e.g., event type like
com.oraclecloud.computeapi.launchinstance.end or resource attributes). Conditions filter which
events trigger the rule.
Why not A, D, or E?
Management Agent Cloud Service (A): This is unrelated to Events Service rules; its for monitoring resources.
Install Key (D): This is used for agent installation, not event rules.
Service Connector (E): While it can work with Events Service, its a separate service and not a
required component of an event rule itself.
These two elements form the core of an OCI Events Service rule, enabling event-driven automation.
Reference: OCI Events Service Rules
QUESTION 4
Choose two FluentD scenarios that apply when using continuous log collection with client-side processing. (Choose two.)
A. Managing apps/services which push logs to Object Storage
B. Comprehensive monitoring for OKE/Kubernetes
C. Monitoring systems that are not currently supported by Management Agent
D. Log Source
Answer: A, B
Explanation:
FluentD is an open-source data collector used for continuous log collection with client-side
processing in OCI Logging. Two applicable scenarios are:
Managing apps/services which push logs to Object Storage (A): FluentD can be configured to collect
logs from applications or services (e.g., Oracle Functions) that write logs to Object Storage buckets. It
processes these logs client-side and forwards them to OCI Logging or Logging Analytics.
Comprehensive monitoring for OKE/Kubernetes (B): FluentD is widely used in Kubernetes
environments like Oracle Container Engine for Kubernetes (OKE) to collect logs from pods,
containers, and nodes. It processes these logs locally before sending them to OCI services for analysis.
Why not C or D?
Monitoring unsupported systems (C): While possible, this is not a primary FluentD scenario in OCI”
its more about extending Management Agent capabilities.
Log Source (D): This is a component of Logging Analytics, not a FluentD scenario.
FluentDs flexibility makes it ideal for these use cases in OCIs observability ecosystem.
Reference: FluentD with OCI Logging, OKE Logging
QUESTION 5
Which of the following is not a key interaction element in the Log Explorer UI of Logging Analytics?
A. Fields Panel
B. Time Picker
C. Scope Filter
D. Dashboard
Answer: D
Explanation:
The Log Explorer UI in OCI Logging Analytics includes four key interaction elements: Fields Panel,
Time Picker, Scope Filter, and Results Panel. These allow users to search, filter, and analyze logs
interactively.
Dashboard (D): This is not part of the Log Explorer UI. Dashboards are separate visualizations in
Logging Analytics for summarizing data, not an interactive element of the Log Explorer.
Why A, B, and C are key elements:
Fields Panel (A): Displays log fields for filtering and analysis.
Time Picker (B): Sets the time range for log queries.
Scope Filter (C): Defines the scope (e.g., compartments, log groups) of the log search.
Reference: Log Explorer UI
I Got My Success Due To Actualkey 1Z0-1111-25 Bundle Pack Actualkey experts I got passed in the 1Z0-1111-25 exam without any worries at all, these exam material products gave me the reason to relax.
Budi Saptarmat
Yahoo! Got Successfully Through The 1Z0-1111-25 Exam Passing Exam is not a easy thanks to Acutalkey.com for providing me actual 1Z0-1111-25 Oracle Cloud Infrastructure 2025 Observability Professional Exam training with there included the Offline and Android simulators helps me success
Melinda
1Z0-1111-25 Exam Best Preparation I have been preparing for 1Z0-1111-25 Oracle Cloud Infrastructure 2025 Observability Professional Exam, I was not sure that I'll be able to pass because of the fact that I am not a good student however;Actualkey.com provided me best and simple exam training pdf's and I passed. I now recommend everyone
Antonio Moreno
Actualkey.com 1Z0-1111-25 Offline Simulator is Best My choice to select Actualkey.com and go for the preparation 1Z0-1111-25 Oracle Cloud Infrastructure 2025 Observability Professional Exam, because I got the short way with the easy way
Liliane Meichner
Actualkey.com 1Z0-1111-25 Exam PDF"s passed with in a week 1Z0-1111-25 exam pdf's that's amazing
James Wilson
Oracle - RELATED EXAMS
Oracle Comm. Billing & Revenue Management: Server Administrator
Questions: 310 | May 8, 2024
Oracle E-Business Suite R12: General Ledger and Receivables Fundamentals
Questions: 330 | May 8, 2024
Oracle E-Business Suite R12: General Ledger and Payables Fundamentals
Questions: 330 | January 5, 2024
Oracle EBS R12: Inventory and Order Management Fundamentals
Questions: 302 | January 5, 2024
Oracle Database 11g: New Features for 9i OCPs Practice Test
Questions: 297 | January 5, 2024
PeopleSoft Application Developer I: People Tools & PeopleCode Practice Test
Questions: 191 | January 5, 2024
Siebel 7.7 Analytics App. Developer Professional Core Exam Practice Test
Questions: 78 | January 5, 2024
PeopleSoft Application Developer II:App Engine & Integration
Questions: 102 | January 5, 2024
Oracle Application Express 3.2: Developing Web Applications
Questions: 52 | January 11, 2024
JD Edwards EnterpriseOne Financial Management 9.0 Essentials
Questions: 72 | January 11, 2024
JD Edwards EnterpriseOne 9 Configurable Network Computing Essentials
Questions: 77 | January 11, 2024
Java Standard Edition 6 Programmer Certified Professional Upgrade Exam
Questions: 96 | August 1, 2024
Java Standard Edition 6 Programmer Certified Professional Exam
Questions: 290 | August 1, 2024
Java Enterprise Edition 5 Web Component Developer Certified Professional Exam
Questions: 276 | August 1, 2024
Java Standard Edition 5 Programmer Certified Professional Exam
Questions: 362 | August 1, 2024
Java Enterprise Edition 5 Web Component Developer Certified Professional Upgrade Exam
Questions: 119 | August 1, 2024
Java Standard Edition 5 Programmer Certified Professional Upgrade Exam
Questions: 138 | August 1, 2024
Oracle Business Intelligence Applications 7.9.6 for ERP Essentials
Questions: 71 | January 11, 2024
MySQL 5 Database Administrator Certified Professional Exam, Part I
Questions: 139 | January 11, 2024
MySQL 5 Database Administrator Certified Professional Exam, Part II
Questions: 138 | January 11, 2024
Java Platform, Enterprise Edition 6 Web Services Developer Certified Expert Exam
Questions: 120 | January 11, 2024
Java Enterprise Edition 5 Business Component Developer Certified Professional Exam
Questions: 305 | January 11, 2024
Java Mobile Edition 1 Mobile Application Developer Certified Professional Exam
Questions: 340 | January 11, 2024
Java Enterprise Edition 5 Business Component Developer Certified Professional Upgrade Exam
Questions: 150 | August 1, 2024
Java Enterprise Edition 5 Web Services Developer Certified Professional Exam
Questions: 183 | August 1, 2024
Java Enterprise Edition 5 Web Services Developer Certified Professional Upgrade Exam
Questions: 96 | August 1, 2024
Oracle Solaris Cluster 3.2 System Administrator Certified Professional Exam
Questions: 243 | August 1, 2024
Java Enterprise Edition 5 Enterprise Architect Certified Master Upgrade Exam
Questions: 144 | August 1, 2024
Oracle Solaris 10 System Administrator Certified Professional Exam, Part I
Questions: 301 | August 1, 2024
Oracle Solaris 10 System Administrator Certified Professional Upgrade Exam
Questions: 612 | August 1, 2024
Oracle Solaris 10 Network Administrator Certified Expert Exam
Questions: 317 | August 1, 2024
Java Enterprise Edition 5 Enterprise Architect Certified Master Exam (Step 1 of 3)
Questions: 238 | August 1, 2024
Oracle Solaris 10 Security Administrator Certified Expert Exam
Questions: 293 | August 1, 2024
Oracle Solaris 10 System Administrator Certified Professional Exam
Questions: 356 | January 11, 2024
Primavera P6 Enterprise Project Portfolio Management Essentials
Questions: 70 | August 1, 2024
Oracle RAC 11g Release 2 and Grid Infrastructure Administration
Questions: 139 | January 11, 2024
Siebel Customer Relationship Management (CRM) 8 Business Analyst
Questions: 74 | January 11, 2024
Java Platform, Enterprise Edition 6 Java Persistence API Developer Certified Expert Exam
Questions: 63 | January 11, 2024
Oracle Unified Business Process Management Suite 11g Essentials
Questions: 77 | January 11, 2024
Oracle E-Business Suite R12.1 Human Capital Management Essentials Exam
Questions: 80 | May 1, 2024
Java Platform, Enterprise Edition 6 Enterprise JavaBeans Developer Certified Expert Exam
Questions: 90 | January 11, 2024
Oracle FLEXCUBE UBS 11 Basic Implementation Essentials Exam
Questions: 76 | January 11, 2024
Oracle User Productivity Kit 11 Technical Consultant Essentials Exam
Questions: 115 | January 11, 2024
Oracle ATG Web Commerce 10 Implementation Developer Essentials
Questions: 86 | January 11, 2024
Primavera P6 Enterprise Project Portfolio Management 8 Essentials Exam
Questions: 84 | January 11, 2024
Oracle Fusion Human Capital Management 11g Human Resources Essentials
Questions: 129 | January 11, 2024
Oracle Business Intelligence Foundation Suite 11g Essentials
Questions: 120 | January 11, 2024
Oracle Fusion Customer Relationship Management 11g Sales Essentials
Questions: 133 | January 11, 2024
Oracle Fusion Middleware 11g: Build Applications with Oracle Forms Exam
Questions: 90 | January 11, 2024
Oracle Fusion Financials 11g Accounts Receivable Essentials
Questions: 123 | January 11, 2024
Java Enterprise Edition 6 Enterprise Architect Certified Master Exam (Step 1 of 3)
Questions: 90 | July 1, 2024
Oracle Exadata Database Machine Administration, Software Release 11.x
Questions: 72 | July 1, 2024
Oracle GoldenGate 11g Certified Implementation Exam Essentials
Questions: 79 | January 15, 2024
Exadata Database Machine Models X3-2 and X3-8 Implementation Essentials
Questions: 71 | January 15, 2024
Oracle Data Integrator 11g Certified Implementation Essentials
Questions: 71 | January 15, 2024
Oracle Eloqua and Oracle Content Marketing Cloud Service 2013 Implementation Essentials
Questions: 75 | September 16, 2024
Oracle Fusion HCM: Talent Management 2014 Certified Implementation Specialist
Questions: 79 | September 16, 2024
SPARC M6-32 and SPARC M5-32 Servers Installation Essentials
Questions: 79 | September 16, 2024
Oracle Fusion Project Portfolio Management 11g Implementation Essentials
Questions: 79 | September 16, 2024
Oracle Utilities Customer Care and Billing 2 Essentials Exam
Questions: 79 | September 16, 2024
Oracle Database 12c: Performance Management and Tuning Exam
Questions: 119 | September 16, 2024
Oracle Communications Session Border Controller Implementation Essentials
Questions: 74 | September 16, 2024
Oracle Revenue Management and Billing 2 Implementation Essentials
Questions: 79 | September 16, 2024
Oracle BigMachines CPQ Cloud Service 2016 Implementation Essentials
Questions: 80 | September 16, 2024
Oracle Financial Crime and Compliance Management 6 Functional Implementation Essentials
Questions: 70 | September 16, 2024
Oracle Database 12c: RAC and Grid Infrastructure Administration
Questions: 153 | January 19, 2024
Oracle Global Human Resources Cloud 2016 Implementation Essentials
Questions: 81 | January 19, 2024
Oracle FLEXCUBE Universal Banking 12 Technical Implementation Essentials
Questions: 83 | January 19, 2024
Oracle FLEXCUBE Universal Banking 12 Advanced Functional Implementation Essentials
Questions: 82 | January 19, 2024
Oracle Application Development Framework 12c Essentials Exam
Questions: 99 | January 19, 2024
Oracle Financials Cloud: General Ledger 2016 Implementation Essentials
Questions: 80 | January 19, 2024
Oracle Certified Expert, Oracle Database 12c: Data Guard Administrator
Questions: 184 | January 19, 2024
Oracle Talent Management Cloud 2016 Implementation Essentials
Questions: 70 | April 11, 2024
Oracle Infrastructure as a Service Cloud 2017 Implementation Essentials
Questions: 107 | April 11, 2024
Oracle Retail Merchandising System 13.2 Foundation Functional Implementer Essentials
Questions: 75 | April 11, 2024
Oracle Taleo Learn Cloud Service 2016 Implementation Essentials
Questions: 79 | April 11, 2024
Oracle Communications BRM Elastic Charging Engine 2017 Implementation Essentials
Questions: 73 | April 11, 2024
Oracle Communications Order and Service Management Server 7 Implementation Essentials
Questions: 89 | April 11, 2024
Oracle Financials Cloud: General Ledger 2017 Implementation Essentials
Questions: 137 | April 11, 2024
Oracle Global Human Resources Cloud 2017 Implementation Essentials Exam
Questions: 94 | April 11, 2024
Oracle Talent Management Cloud 2017 Implementation Essentials
Questions: 114 | April 11, 2024
Oracle Financials Cloud: Receivables 2016 Implementation Essentials
Questions: 165 | April 11, 2024
JD Edwards EnterpriseOne Financial Management 9.2 Implementation Essentials
Questions: 160 | April 11, 2024
Oracle Exadata Database Machine and Cloud Service 2017 Implementation Essentials
Questions: 153 | April 11, 2024
Oracle Communications Session Border Controller 7 Basic Implementation Essentials
Questions: 70 | April 11, 2024
Oracle Identity Governance Suite 11g PS3 Implementation Essentials
Questions: 81 | April 11, 2024
Oracle Financials Cloud: Payables 2017 Implementation Essentials
Questions: 81 | April 11, 2024
Oracle Eloqua Marketing Cloud Service 2017 Implementation Essentials
Questions: 80 | April 11, 2024
Oracle Project Portfolio Management Cloud 2017 Implementation Essentials
Questions: 91 | April 11, 2024
Oracle Incentive Compensation Cloud 2017 Implementation Essentials
Questions: 75 | April 11, 2024
Oracle Financials Cloud: Receivables 2017 Implementation Essentials
Questions: 80 | April 11, 2024
Oracle Responsys Marketing Platform Cloud Service 2017 Implementation Essentials
Questions: 71 | April 11, 2024
Oracle Enterprise Planning and Budgeting Cloud Service 2017 Implementation Essentials
Questions: 93 | April 11, 2024
Oracle Enterprise Performance Reporting Cloud Service 2017 Implementation Essentials
Questions: 70 | April 11, 2024
Oracle Workforce Compensation Cloud 2017 Implementation Essentials
Questions: 178 | April 11, 2024
Oracle Taleo Recruiting Cloud Service 2016 Implementation Essentials
Questions: 162 | April 11, 2024
JD Edwards EnterpriseOne Configurable Network Computing 9.2 Implementation Essentials
Questions: 88 | May 8, 2024
Oracle Field Service Cloud Service 2017 Implementation Essentials
Questions: 132 | April 11, 2024
Oracle Revenue Management Cloud Service 2017 Implementation Essentials
Questions: 60 | April 11, 2024
Oracle Transportation Management Cloud Service 2017 Implementation Essentials Exam
Questions: 88 | April 11, 2024
Oracle Upgrade to Java SE 8 OCP ( Java SE 6 and all prior versions) Exam
Questions: 60 | April 11, 2024
Oracle Cost Management Cloud 2017 Implementation Essentials Exam
Questions: 70 | April 11, 2024
Oracle Absence Management Cloud 2017 Implementation Essentials
Questions: 79 | April 11, 2024
Oracle Financial Consolidation and Close Cloud Service 2017 Implementation Essentials
Questions: 86 | April 11, 2024
Oracle Benefits Cloud 2017 Implementation Essentials Version: 9.0
Questions: 60 | April 11, 2024
Oracle Planning Central Cloud Service 2017 Implementation Essentials
Questions: 75 | April 11, 2024
Oracle Customer Data Management Cloud Service 2017 Implementation Essentials
Questions: 65 | April 11, 2024
Oracle Knowledge Management Cloud 2017 Implementation Essentials
Questions: 71 | April 11, 2024
Oracle Engagement Cloud 2018 Implementations Essentials Exam
Questions: 76 | January 21, 2024
Oracle Cloud Platform Application Development 2018 Associate
Questions: 56 | January 21, 2024
Oracle Workforce Compensation Cloud 2018 Implementation Essentials
Questions: 178 | January 21, 2024
Oracle Order Management Cloud 2018 Implementation Essentials Exam
Questions: 84 | January 21, 2024
Oracle Manufacturing Cloud 2018 Implementation Essentials Exam
Questions: 66 | January 21, 2024
Oracle Financials Cloud: Payables 2018 Implementation Essentials Exam
Questions: 95 | January 21, 2024
Oracle Procurement Cloud 2018 Implementation Essentials Exam
Questions: 102 | January 21, 2024
Oracle Global Human Resources Cloud 2018 Implementation Essentials Exam
Questions: 96 | January 21, 2024
Oracle Inventory Management and Enterprise Structures Cloud 2018 Implementation Essentials Exam
Questions: 75 | January 21, 2024
Oracle Customer Data Management Cloud Service 2018 Implementation Essentials
Questions: 65 | January 21, 2024
Oracle Project Portfolio Management Cloud 2018 Implementation Essentials Exam
Questions: 91 | January 21, 2024
Oracle Absence Management Cloud 2018 Implementation Essentials
Questions: 79 | January 21, 2024
Oracle Incentive Compensation Cloud 2018 Implementation Essentials
Questions: 75 | January 21, 2024
Oracle Accounting Hub Cloud 2018 Implementation Essentials
Questions: 60 | January 21, 2024
Oracle Time and Labor Cloud 2018 Implementation Essentials Exam
Questions: 71 | January 21, 2024
Oracle Product Hub Cloud 2018? Implementation Essentials Exam
Questions: 72 | January 21, 2024
Oracle Talent Management Cloud 2018 Implementation Essentials Exam
Questions: 70 | January 21, 2024
Oracle Revenue Management Cloud Service 2018 Implementation Essentials Exam
Questions: 60 | January 21, 2024
Oracle Cost Management Cloud 2018 Implementation Essentials Exam
Questions: 70 | January 21, 2024
Oracle Financials Cloud: General Ledger 2018 Implementation Essentials
Questions: 78 | January 21, 2024
Oracle Planning Central Cloud Service 2018 Implementation Essentials
Questions: 75 | January 21, 2024
Oracle Financials Cloud : Receivables Cloud 2018 Implementation Essentials
Questions: 80 | January 21, 2024
Oracle Cloud Platform Identity and Security Management 2018 Associate
Questions: 67 | January 21, 2024
JD Edwards EnterpriseOne Distribution 9.2 Implementation Essentials
Questions: 75 | November 8, 2024
Oracle Cloud Platform Systems Management 2018 Associate Exam
Questions: 70 | November 8, 2024
Oracle Cloud Platform Enterprise Mobile 2018 Associate Developer Exam
Questions: 70 | November 8, 2024
Oracle Warehouse Management Cloud 2018 Implementation Essentials
Questions: 71 | November 8, 2024
Oracle Cloud Platform Big Data Management 2018 Associate Exam
Questions: 60 | November 8, 2024
Oracle Data Management Platform Cloud 2017 Implementation Essentials
Questions: 74 | November 8, 2024
Oracle Eloqua Marketing Cloud Service 2019 Implementation Essentials Exam
Questions: 70 | November 8, 2024
Oracle Global Human Resources Cloud 2019 Implementation Essentials Exam
Questions: 96 | November 8, 2024
Oracle CPQ Cloud Service 2019 Implementation Essentials Exam
Questions: 80 | November 8, 2024
Oracle Time and Labor Cloud 2019 Implementation Essentials Exam
Questions: 78 | November 8, 2024
Oracle Policy Automation Cloud Service 2017 Implementation Essentials Exam
Questions: 80 | November 8, 2024
Oracle Risk Management Cloud 2018 Implementation Essentials Exam
Questions: 75 | November 8, 2024
Oracle Absence Management Cloud 2019 Implementation Essentials Exam
Questions: 79 | November 8, 2024
Oracle Field Service Cloud Service 2019 Implementation Essentials Exam
Questions: 81 | November 8, 2024
Oracle Responsys Marketing Platform 2019 Implementation Essentials Exam
Questions: 71 | November 8, 2024
Oracle Cloud Platform Enterprise Analytics 2019 Associate Exam
Questions: 72 | November 8, 2024
Oracle Cloud Platform Application Integration 2019 Associate Exam
Questions: 71 | November 8, 2024
Oracle Financials Cloud: Receivables 2019 Implementation Essentials Exam
Questions: 80 | November 8, 2024
Oracle Revenue Management Cloud Service 2019 Implementation Essentials Exam
Questions: 60 | November 8, 2024
Oracle Global Trade Management 2018 Implementation Essentials Exam
Questions: 76 | January 21, 2024
Oracle Utilities Customer Cloud Service 2019 Implementation Essentials Exam
Questions: 70 | May 9, 2024
Oracle Cloud Infrastructure 2020 Architect Associate Exam
Questions: 60 | December 31, 2024
Oracle Cloud Infrastructure 2020 Architect Professional Exam
Questions: 50 | November 8, 2024
Oracle Cloud Platform Application Integration 2020 Specialist Exam
Questions: 59 | November 8, 2024
Oracle SCM Transportation and Global Trade Management Cloud 2020 Implementation Essentials Exam
Questions: 55 | September 16, 2024
Oracle Inventory Cloud 2020 Implementation Essentials Exam
Questions: 78 | February 24, 2025
Oracle Eloqua CX Marketing 2020 Implementation Essentials Exam
Questions: 60 | November 8, 2024
Oracle Procurement Cloud 2020 Implementation Essentials Exam
Questions: 55 | July 1, 2024
Oracle Financials Cloud: General Ledger 2020 Implementation Essentials Exam
Questions: 55 | September 16, 2024
Oracle Financial Consolidation and Close 2020 Implementation Essentials
Questions: 116 | May 10, 2024
Oracle Account Reconciliation 2020 Implementation Essentials Exam
Questions: 60 | September 16, 2024
Oracle Cloud Infrastructure 2021 Cloud Operations Associate Exam
Questions: 55 | December 27, 2024
Oracle Global Human Resources Cloud 2021 Implementation Essentials Exam
Questions: 57 | September 16, 2024
Oracle Financials Cloud: Payables 2021 Certified Implementation Specialist
Questions: 55 | September 16, 2024
Oracle Utilities Customer Cloud Service 2021 Implementation Essentials Exam
Questions: 60 | September 16, 2024
Oracle Financials Cloud: Receivables 2021 Implementation Essentials Exam
Questions: 58 | September 16, 2024
Oracle Field Service Cloud Service 2020 Implementation Essentials Exam
Questions: 61 | September 16, 2024
Oracle Global Human Resources Cloud 2021 Implementation Essentials Exam
Questions: 39 | September 16, 2024
Oracle Accounting Hub Cloud 2020 Implementation Essentials Exam
Questions: 43 | September 16, 2024
Oracle SCM Transportation and Global Trade Management Cloud 2021 Implementation Essentials Exam
Questions: 54 | September 16, 2024
Oracle Cloud Infrastructure Developer 2021 Associate Exam
Questions: 55 | September 16, 2024
Oracle HCM Business Process Foundations Associate Rel 1 Exam
Questions: 55 | September 16, 2024
Oracle Recruiting Cloud 2022 Implementation Professional Exam
Questions: 116 | September 16, 2024
Oracle Payroll Cloud 2022 Implementation Professional Exam
Questions: 111 | September 16, 2024
Oracle Account Reconciliation 2021 Implementation Essentials Exam
Questions: 60 | September 16, 2024
Oracle Cloud Infrastructure 2021 Architect Associate Exam
Questions: 240 | September 16, 2024
Oracle Cloud Infrastructure Foundations 2021 Associate Exam
Questions: 156 | September 16, 2024
Oracle Time and Labor Cloud 2022 Implementation Professional Exam
Questions: 83 | September 16, 2024
Oracle Responsys Marketing Platform 2022 Implementation Professional Exam
Questions: 71 | September 16, 2024
Oracle Manufacturing Cloud 2022 Implementation Professional Exam
Questions: 66 | September 16, 2024
Oracle Cloud Infrastructure 2022 Architect Professional Exam
Questions: 165 | September 16, 2024
Oracle Project Management Cloud 2022 Implementation Professional Exam
Questions: 126 | September 16, 2024
Oracle Planning and Collaboration Cloud 2022 Implementation Professional Exam
Questions: 109 | September 16, 2024
Oracle Enterprise Data Management Cloud 2022 Implementation Professional Exam
Questions: 60 | July 1, 2024
Oracle Account Reconciliation 2022 Implementation Professional Exam
Questions: 79 | July 1, 2024
Oracle Fusion Service 2023 Implementation Professional - Delta Exam
Questions: 76 | July 1, 2024
Oracle Account Reconciliation 2023 Implementation Professional - Delta Exam
Questions: 80 | May 14, 2024
Oracle B2C Service Integration and Development 2023 Implementation Professional
Questions: 55 | July 1, 2024
Oracle Enterprise Data Management Cloud 2023 Implementation Professional - Delta Exam
Questions: 60 | July 1, 2024
Oracle Profitability and Cost Management Cloud Service 2023 Implementation Professional - Delta Exam
Questions: 55 | July 1, 2024
Oracle Utilities Meter Solution Cloud Service 2022 Implementation Professional Exam
Questions: 51 | July 1, 2024
Oracle Planning and Collaboration Cloud 2022 Implementation Professional Exam
Questions: 109 | July 1, 2024
Oracle Financials Cloud: Payables 2022 Implementation Professional Exam
Questions: 140 | July 1, 2024
Oracle Global Human Resources Cloud 2022 Implementation Professional Exam
Questions: 126 | July 1, 2024
Oracle Cost Management Cloud 2022 Implementation Professional Exam
Questions: 79 | July 1, 2024
Oracle Absence Management Cloud 2022 Implementation Professional Exam
Questions: 100 | July 1, 2024
Oracle Talent Management Cloud 2022 Implementation Professional Exam
Questions: 70 | July 1, 2024
Oracle Financials Cloud: General Ledger 2022 Implementation Professional Exam
Questions: 102 | July 1, 2024
Oracle Manufacturing Cloud 2022 Implementation Professional Exam
Questions: 66 | July 1, 2024
Oracle HCM Business Process Foundations Associate Rel 2 Exam
Questions: 56 | July 1, 2024
Oracle Profitability and Cost Management Cloud Service 2023 Implementation Professional Exam
Questions: 55 | July 1, 2024
Oracle Service Center 2023 Implementation Professional Exam
Questions: 97 | July 1, 2024
Oracle Field Service 2023 Implementation Professional Exam
Questions: 132 | July 1, 2024
Oracle Risk Management Cloud 2023 Implementation Professional Exam
Questions: 75 | July 1, 2024
Oracle Benefits Cloud 2023 Implementation Professional Exam
Questions: 60 | July 1, 2024
Oracle Cloud Infrastructure 2023 Application Integration Professional Exam
Questions: 164 | July 1, 2024
Oracle Cloud Platform Application Development 2023 Specialist Exam
Questions: 55 | July 1, 2024
Oracle Financials Cloud: Receivables 2023 Implementation Professional Exam
Questions: 32 | July 1, 2024
Oracle Cloud Infrastructure 2023 Developer Professional Exam
Questions: 100 | July 1, 2024
Oracle Cloud Database Migration and Integration 2022 Professional Exam
Questions: 110 | July 1, 2024
Oracle Machine Learning using Autonomous Database 2023 Associate Exam
Questions: 74 | July 1, 2024
Oracle Cloud Data Management 2023 Foundations Associate Exam
Questions: 79 | July 1, 2024
Oracle Cloud Infrastructure 2023 Foundations Associate Exam
Questions: 185 | July 1, 2024
Oracle Financials Business Process Foundations Associate Rel 2 Exam
Questions: 42 | July 1, 2024
Oracle Cloud Infrastructure Data Science 2023 Professional Exam
Questions: 80 | July 1, 2024
Oracle Cloud Infrastructure 2022 Cloud Operations Professional Exam
Questions: 87 | July 1, 2024
Oracle SCM Business Process Foundations Associate Rel 2 Exam
Questions: 52 | July 1, 2024
Oracle Cloud Infrastructure 2023 Observability Professional
Questions: 67 | July 1, 2024
Oracle Cloud Infrastructure 2023 Security Professional Exam
Questions: 169 | July 1, 2024
Oracle Cloud Infrastructure 2023 AI Foundations Associate Exam
Questions: 30 | July 1, 2024
Oracle Cloud Infrastructure 2023 Architect Professional Exam
Questions: 13 | July 1, 2024
Oracle Cloud Fusion Analytics Warehouse 2023 Implementation Professional Exam
Questions: 55 | July 1, 2024
Oracle Procurement Business Process Foundations Associate Rel 2 Exam
Questions: 55 | July 1, 2024
Oracle Cloud Infrastructure 2023 Multicloud Architect Associate Exam
Questions: 41 | July 1, 2024
Oracle Cloud Infrastructure 2023 Enterprise Analytics Professional Exam
Questions: 69 | July 1, 2024
Oracle Learning Cloud 2023 Implementation Professional Exam
Questions: 45 | July 1, 2024
Oracle Database 19c: RAC, ASM, and Grid Infrastructure Administration Exam
Questions: 77 | July 1, 2024
Oracle Cloud Infrastructure 2023 Digital Assistant Professional Exam
Questions: 55 | September 16, 2024
Oracle Fusion Cloud Procurement 2023 Implementation Professional Exam
Questions: 31 | September 16, 2024
Oracle Guided Learning Content Developer Foundations Associate Rel 1
Questions: 90 | September 16, 2024
Oracle Cloud Infrastructure for Sunbird Ed Specialty - Rel 1 Exam
Questions: 40 | September 16, 2024
Oracle Order Management Cloud Order to Cash 2023 Implementation Professional
Questions: 152 | July 1, 2024
Oracle Financial Consolidation and Close 2023 Implementation Professional Exam
Questions: 60 | July 1, 2024
Oracle Account Reconciliation 2023 Implementation Professional
Questions: 79 | July 1, 2024
Oracle Database 19c: Performance Management and Tuning Exam
Questions: 55 | November 7, 2024
Oracle Cloud Infrastructure 2021 HPC and Big Data Solutions Associate Exam
Questions: 55 | November 7, 2024
Oracle Cloud Infrastructure 2024 Generative AI Professional Exam
Questions: 40 | November 7, 2024
Oracle Cloud Infrastructure 2024 Architect Associate Exam
Questions: 51 | August 26, 2024
Oracle Cloud Infrastructure 2024 Foundations Associate Exam
Questions: 40 | August 26, 2024
Oracle Cloud Infrastructure 2024 AI Foundations Associate Exam
Questions: 41 | August 26, 2024
Oracle Cloud Infrastructure 2024 Application Integration Professional Exam
Questions: 50 | September 1, 2024
Oracle Cloud Infrastructure 2024 Migration Architect Professional Exam
Questions: 55 | August 28, 2024
Oracle Cloud Infrastructure 2024 Developer Professional Exam
Questions: 100 | August 29, 2024
Oracle Absence Management Cloud 2024 Implementation Professional Exam
Questions: 72 | September 14, 2024
Oracle Manufacturing Cloud 2024 Implementation Professional Exam
Questions: 50 | September 18, 2024
Oracle Exadata Database Machine X9M Implementation Essentials Exam
Questions: 85 | December 16, 2024
Oracle Planning and Collaboration Cloud 2024 Implementation Professional Exam
Questions: 139 | January 30, 2025
Oracle Cloud Infrastructure 2024 DevOps Professional Exam
Questions: 50 | November 19, 2024
Oracle Cloud Infrastructure 2024 Cloud Operations Professional Exam
Questions: 93 | December 19, 2024
Oracle Accounting Hub Cloud 2024 Implementation Professional Exam
Questions: 80 | February 17, 2025
Oracle Financials Cloud: Payables 2024 Implementation Professional Exam
Questions: 29 | February 20, 2025
Oracle Inventory Cloud 2024 Implementation Professional Exam
Questions: 89 | February 20, 2025
Oracle Cost Management Cloud 2020 Implementation Essentials Exam
Questions: 79 | February 24, 2025
Oracle Order Management Cloud Order to Cash 2020 Implementation Essentials Exam
Questions: 84 | February 24, 2025
Oracle Profitability and Cost Management 2021 Implementation Essentials Exam
Questions: 55 | February 24, 2025
Oracle Narrative Reporting 2020 Implementation Essentials Exam
Questions: 70 | February 24, 2025
Oracle Narrative Reporting 2021 Implementation Essentials Exam
Questions: 70 | February 24, 2025
Oracle Project Management Cloud 2024 Implementation Professional Exam
Questions: 126 | March 4, 2025
Oracle Fusion Cloud Applications HCM Foundations Associate - Rel 1 Exam
Questions: 25 | March 4, 2025
Oracle Fusion Cloud Procurement 2024 Implementation Professional Exam
Questions: 73 | March 8, 2025
Oracle Cloud Infrastructure 2025 Observability Professional Exam
Questions: 61 | March 25, 2025
Exams code, certifications, vendor or keywords

Copyright © 2009 - 2025 Actualkey. All rights reserved.